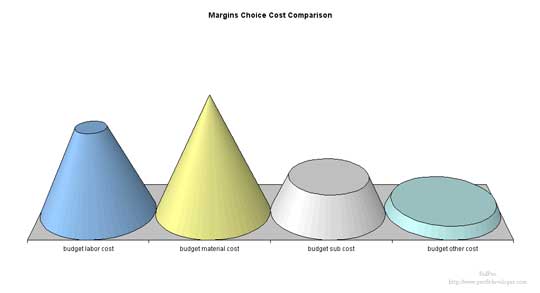
Cost Chart
This chart is a Microsoft© Excel-based Custom Cone style graphic that depicts Labor, Material, Subcontractor and Other costs. The largest cost item will be shown as complete cone. Subsequent cones will be portions of cones equal to the percentage difference in items costs. Thus a cone that is ½ the size of a full cone would represent ½ the cost amount of the full cone.
As you progress with multiple projects, the “cone” relationship will start to develop patterns that can be used as a “seat-of-the-pants” feel for proper relationship in your company specific estimating process. After several projects of similar design, you should start to see category cost indicators that may help you bid faster, cheaper or better (pick two).
Figure 1 Cost Comparisons of Item 1
 |
All Rights Reserved
No use of information without express written permission|
from Peter Buitenhek