Margins Chart
This
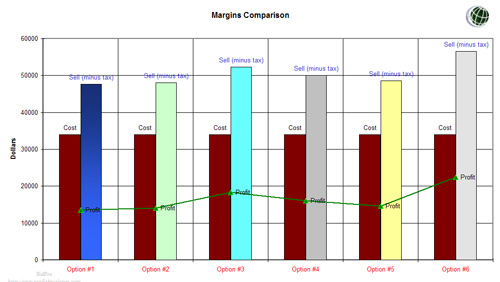
Margins Chart is a Microsoft® Excel-based custom line/column style
graphic that depicts the Margins Sheet Options 1 – 6. The project
cost and sell price are depicted as 2 clustered columns with the profit
dollars represented by the line.
The graphic depiction of each Margin Sheet Option (cost, sell price and
profit) allows a quick view of how each item could contribute to
the company bottom-line profit margins.
In Figure 1 the following items (used as chart input) would be calculated using the values from our demo project (note: complete numbers without rounding).
Figure 1 Calculated Items from Margins Sheet

In our demo project, the obvious winner (highest profit) would be Option #6. This Option 6 came from the Margins Sheet and was depicted by the T & M Rate of 50% material markup and $60/hour labor rate. However, we elected to use Option #3 because we felt our bid would be more competitive.
Option 1 is the result of all items listed in the Parameter, Labor, Material and Summary Sheets.
Option 2 has the same input as Item 1 but each major category can be adjusted by the GMP.
Option 3 takes all costs and adjusts (by category percentage) the user requested GMP.
Option 4 takes all costs and adjusts (by category percentage) the user requested sell price.
Option 5 takes all costs and adjusts (by category percentage) and applies the corporate GMP set on the Summary Sheet
Option 6 (Change Order) applies a Time & Material Rate to all labor, material, subcontractor and other costs.
One example of the Change Order option came from a nationwide company that had us install a certain product in our local location. After the install, they asked us to install the same product at different locations in our area, but on a Time & Material basis. This is a simple matter for BidPro: we used the existing fixed price bid and applied a material and labor markup to get our sell price, profit, GMP and ROI. We rebid in less than 2 minutes whereas other vendors needed time to calculate T & M rates accurately.
All Rights Reserved
No use of information without express written permission|
from Peter Buitenhek